
Stress Score: Daily Personal Insights
One of the breakthrough innovations we had with Healthzilla was the quantification of recovery. We had workout programs, which were personalized to each user based on strength and cardiovascular fitness tests. Each program would use different exercises based on your test results. That left the question: if you’re supposed to go to the gym three times a week, which days are best? We didn’t want to leave it to the users’ subjective feelings, but make it automated and scientific. At that time, the Apple Watch had just added the ability to read Heart Rate Variability (“HRV”). For our purposes here, suffice to say that it’s a leading biometric indicator for your nervous system. You can read a lot more in-depth here. HRV tells you how stressed your body is, for whatever reason. There’s pretty solid experience in professional sports in using HRV for recovery. So how do you measure it?
Some devices measure it during the night, others intermittently throughout the day. Because HRV is such a volatile metric, it fluctuates massively during the day. Since your nervous system is literally connected to every major organ of your body, it’s impossible to pinpoint what is causing those changes. For that reason, in most clinical studies involving HRV you’re measuring a 24-hour standard, or a controlled morning measurement. We opted for the latter based on our own testing. So, problem solved?
NOTE: No wearable? No problem! Just use our fingertip Stress Scan to capture RHR and HRV from your fingertip in just 60 seconds.
Not so much. Well, since HRV is measured as the standard deviation of the pause between heartbeats, in milliseconds, how much is good? It turns out, that HRV is highly subjective. So rather than the absolute reading, it’s important to pay attention to trends. Is your HRV lower or higher than normal? That you can use. But now you need a spreadsheet. Or an app. Like Healthzilla.
The trend is your friend
So that’s where we started. We would analyze your HRV patterns, to see if today was above/below average for the week. In the case of HRV, generally, more is better. So that would be a good day. Conversely, a much lower value than usual would be a great indicator for a rest day, or at least lower intensity.
That works for most people in a good training phase. The problem is when things change. You get sick or injured. You travel. If we just look at one week, then your HRV in a sucky week will look okay as part of that sucky trend. So we expanded to also compare your whole week to the previous month. That gives us a view of chronic changes. If your whole week is off, and that can often be an indicator of getting or being sick, meaning you better rest right now.
A holistic view on Stress
HRV is a great data point. Arguably, the best one we have on stress. But, it’s not the only one.
Resting Heart Rate: Physiological Stress
So we wanted to expand the scope of our analytics to cover the other major biometric signal in Resting Heart Rate (“RHR”). While a couch potato will often have an RHR in the 70’s, athletes can go as low as 30’s. So like HRV, for the purposes of stress and recovery, the trend is more relevant than the absolute number. Elevated RHR can be a signal of increased stress within the body, again caused by anything from psychological pressures to fighting infection. Similarly to HRV, we’re interested in that morning reading before you get out of bed, to control for other variables skewing the data.
Workouts: Recovery and Stress
If HRV and RHR tell the story of how your body is coping with stressors, then we also want to look at what you’re doing to cause all this stress. Here, given that we’re looking at morning readings for RHR and HRV, we actually care more about your exercise yesterday. That means your HRV and RHR tell us about how well you’ve recovered from yesterday and can guide you into planning for today.
Sleep: Brain Recovery
To complete the behavioral patterns affecting stress, we look at what you did during the night towards recovery. While there are many ways to quantify sleep quality, we chose to start with simple total sleep duration, as it is consistent across apps and devices recording that data. Adequate sleep is crucial to give your entire body a chance to recover, but most importantly your brain. The different phases of sleep such as Deep Sleep and REM Sleep drive various types of recovery processes.
Patterns of Stress
So now we have all these great data points and looking at trends over multiple overlapping time windows. What now? Well, now the challenge is to understand how these data points and their trends work together. Consider these three examples. In one scenario, you’re working out and sleeping normally, and your biometric data is stable. Now imagine the same scenario, but your biometric is getting worse. Finally, you’ve started a new workout regime and falling behind on sleep, but your biometric data is coping well. Clearly, the implications for each are quite different.
For example, your RHR might be lower than the rest of the week, but what if the week itself is higher than average for the month? Which is worse, having bad daily data or bad weekly data? Are there circumstances in which these changes can be attributed to behavioral changes in sleep or workouts? The data raises more questions than it answers!
This is why we developed our proprietary Machine Learning algorithm, that was trained with 700+ different patterns between the data points and their trends over different time windows. We believe most users do not need pages of charts, but simple insights that they can use in their decision making. So our algorithm gives you a simple English answer for your Stress Score, which is what we always wanted from the start.

Screenshot from the Stress Score screen, showing active trends for RHR, HRV, sleep, and workouts. The bracket indicates whether the sample is above or below the expected trend.

This is what you can expect if you tax your body too much. Zilla doesn’t look to happy about it!
Stress Score Outputs
While some people love geeking out about their data, us included, most would just prefer the one-word answer in plain English. So that’s what you get from Healthzilla. Depending on what our pattern detection algorithm finds, it will give you a score each day:
Great means you’re having an exceptional day and should use that to charge hard for your goals!
Good means you’re stable and everything looks normal, so you can plan freely for the day.
Easy means it’s nothing to worry about, but there are signs of lower recovery, and you should lower intensity today.
Rest means you’re hitting a rough patch in your data trends and should consider taking a day off to avoid worsening.
Sick means that it’s all gone pear-shaped, and there is a chronic bad trend in your biometric data. You have to rest.
Graph for past 7-days’ Stress Score
To further aid you in understanding your data, we also show you a graph of your scores along with a “stress thermometer” scale for easy interpretation. As long as things are steady in the green, you’re doing things right and can even do more. As soon as things start digging into the red zone, you know you’re starting to hit the bleeding edge of your performance, and should consider additional ways to boost recovery.
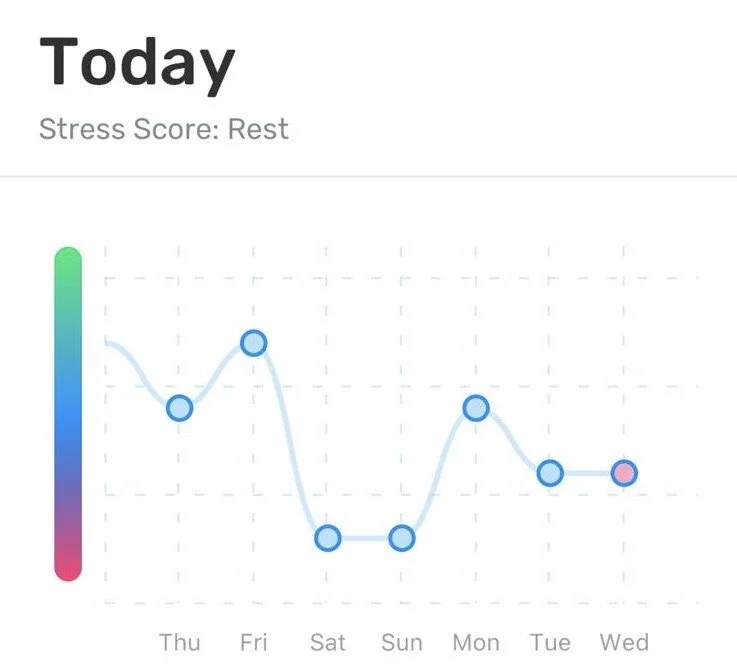
Screenshot from the Healthzilla app showing your last 7-days worth of Stress Scores. You generally want to stay towards the top green area. Dips into the blue and red indicate increased stress levels.
Recommendations based on Stress Score

If you’re off your game, the app is going to recommend low-impact recovery oriented habits.
Well, how do you actually use the Stress Score? It’s useful to have a simple one-word insight into your stress levels, but only if you make decisions based on it. That’s why on the main dashboard, we organize your weekly routine of habits. Those habits that are recommended for today based on your Stress Score are right at the top for easy access.
For example, high intensity habits like gym workouts will get recommended if you’re all good. If you’re down on your Stress Score, you will see lower intensity activities like walking, and active recovery like sleep and meditation if you’re really beat down!
Since the dashboard only shows habits you already have, this way you can integrate the Stress Score into your routines effortlessly.
Daily Stress Score Notification
The best part is that to get all this amazing information, you don’t need to do anything at all. If you have a wearable device that produces either HRV or RHR data, then we can run the Stress Score algorithm in the background and just send you the result! Devices that support background Stress Scores include the Apple Watch, Oura Ring, and Fitbit’s Versa, Ionic, Charge, Inspire HR, and Alta HR models.
Instead of having to schedule it for a specific time, the app actually detects your first steps in the morning. Once you start moving out of bed with your phone or Apple Watch, we run the algorithm. That way you’ll get your analysis just in time to decide how to approach your day, even before you have your cup of coffee ready!

An example of your analysis delivered to you right when you need it most in the morning.
FAQ for the Stress Score
Here are some questions that have come up before, that might help you, too. Feel free to add comments below if there’s something you’d like us to clarify!
Q: I have a wearable device, but the dashboard just says to sync my data or do the Stress Scan. Why isn’t my data syncing?
A: This might happen for a few reasons:
1) Your wearable devices does not support RHR or HRV data. For example, just heart rate isn’t enough, it must be resting heart rate specifically. Any Fitbit device that has heart rate will also save RHR!
2) Your device hasn’t synced its data yet, so the Healthzilla can’t read it. With Apple Watch, check that your watch is paired and connected to your phone. With Oura Ring and Fitbit devices, you can check their own app first to see if the latest data has synced.
3) You haven’t authorized your device with Healthzilla. Go to the Habits Tab (last icon) and tap on the Settings icon in the top right corner. Check the Devices section, if your device has the toggle switch on. If not, tap the toggle to log in and authorize.Q: How can my weekly trend be (Low), but today’s trend is (Normal), if today’s RHR value is actually lower than the weekly average?
A: This is because the trend for today is calculated against your weekly average, but your weekly trend is calculated against your entire month’s data. So normal for today can be higher or lower than normal for the week.
Icons made by Freepik from www.flaticon.com