
Healthzilla Launches World's First A.I. Based Stress Detection
The team at Healthzilla has recently extended the smartphone camera-based heart rate monitor with a new capability. We believe this is the world’s first direct real-time measure of stress. The basis for this new capability is data from tens of thousands of fingertip measurements our users have shared with us voluntarily for research purposes. This large dataset has allowed us to apply cutting-edge Machine Learning technology to detect signs of stress reported by users.

Example of some cleaned heartbeats from our fingertip Stress Scan recorded at 30 FPS.
How does stress detection work?
The first part of the solution is our dataset, which we have painstakingly cleaned to serve as a stable base for training. We have collected tens of thousands of measurements so far, giving us a considerable dataset to train on. Still, a key aspect of training is to ensure you have enough positive samples that you’re trying to predict. To further increase our dataset we split the 60-second measurements into 3-second sections.
The data is fed into a Machine Learning model to be trained. In our case, we are using a very deep and complex form of Convolutional Neural Networks designed for the analysis of time-series data. Tuning and training these models even with the latest Nvidia GPU hardware takes hours.

Example of the cutting-edge InceptionTime model architecture used as a basis for our Stress Scan A.I. algorithm.
How do I interpret the stress detection results?
Using the app, you will now see the results screen includes a new purple section at the top. This box gives you information about the stress detection results:
Your overall % of stress. Think of this as a scale from 0-100, meaning a low figure means not much stress, and something closer to 100 means lots of stress. You should monitor this number daily.
Sections with detected stress. The purple dots highlight which sections (3-seconds each) of the 60-second measurement showed signs of stress. If you notice they are bunched into a group at the beginning or end of the measurement, perhaps you were momentarily stressed. If the purple dots are evenly spread out it means the result is consistent.
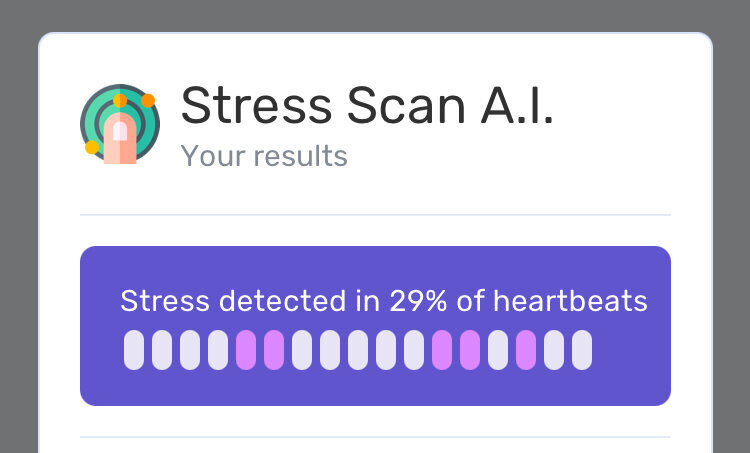
Example from the updated results screen after your measurement. The purple dots below show you the specific section of the 60 second measurement that stress was detected in.
How accurate is the stress detection?
In our testing so far, we are achieving roughly 75% accuracy. Why not 100%? Well, because the dataset is manually tagged by users when they feel stressed. Not only are there many kinds of stress, but people’s subjective assessment of stress levels would differ. So we believe this is a good starting point, as it will detect most cases of stress and report minimal false cases.